Disclaimer:
The following are a series of tables containing the demographic category and the percentage of students in each category, aggregated by grade groups. Grade groups were JK-6, Grade 7-12, and JK-12 (i.e., the whole board). The data source of these results was the student census questionnaire administered in 2022/23 academic year.
For some tables there are additional results. These additional results were added into the table when data that were like those from the student census were available from Statistics Canada data for the Thunder Bay and Region had data on some demographic categories. When these data were available, they were added to the tables.
| Demographic Category | JK-6 | 7-12 | JK-12 | Thunder Bay |
| Born in Canada | ||||
| Yes | 93% | 88% | 90% | 91% |
| No | 7% | 8% | 8% | 9% |
| Non-response | <1% | 4% | 3% |
| Demographic Category | JK-6 | 7-12 | JK-12 | Thunder Bay |
| Language First Spoken | ||||
| English | 92% | 90% | 90% | 84% |
| French | 2% | 5% | 4% | 2% |
| Ojibwe | <1% | 2% | 2% | <1% |
| Languages <1% each |
· Languages <1% each indicates that other languages were identified but less than 1% of the census respondents indicated it was students’ language first spoken. These languages included: Anishinabemowin, Arabic, British, Irish, Chinese, Dari, Italian, Korean, Nepali, Not sure, OjiCree, Polish, Punjabi, Russian, Somali, Spanish, Sri Lankan, Urdu, and Vietnamese.
| Demographic Category | JK-6 | 7-12 | JK-12 | Thunder Bay |
| Indigenous Identity | ||||
| First Nations | 10% | 12% | 12% | 9% |
| Inuit | <1% | 1% | 1% | <1% |
| Métis | 4% | 4% | 4% | 3% |
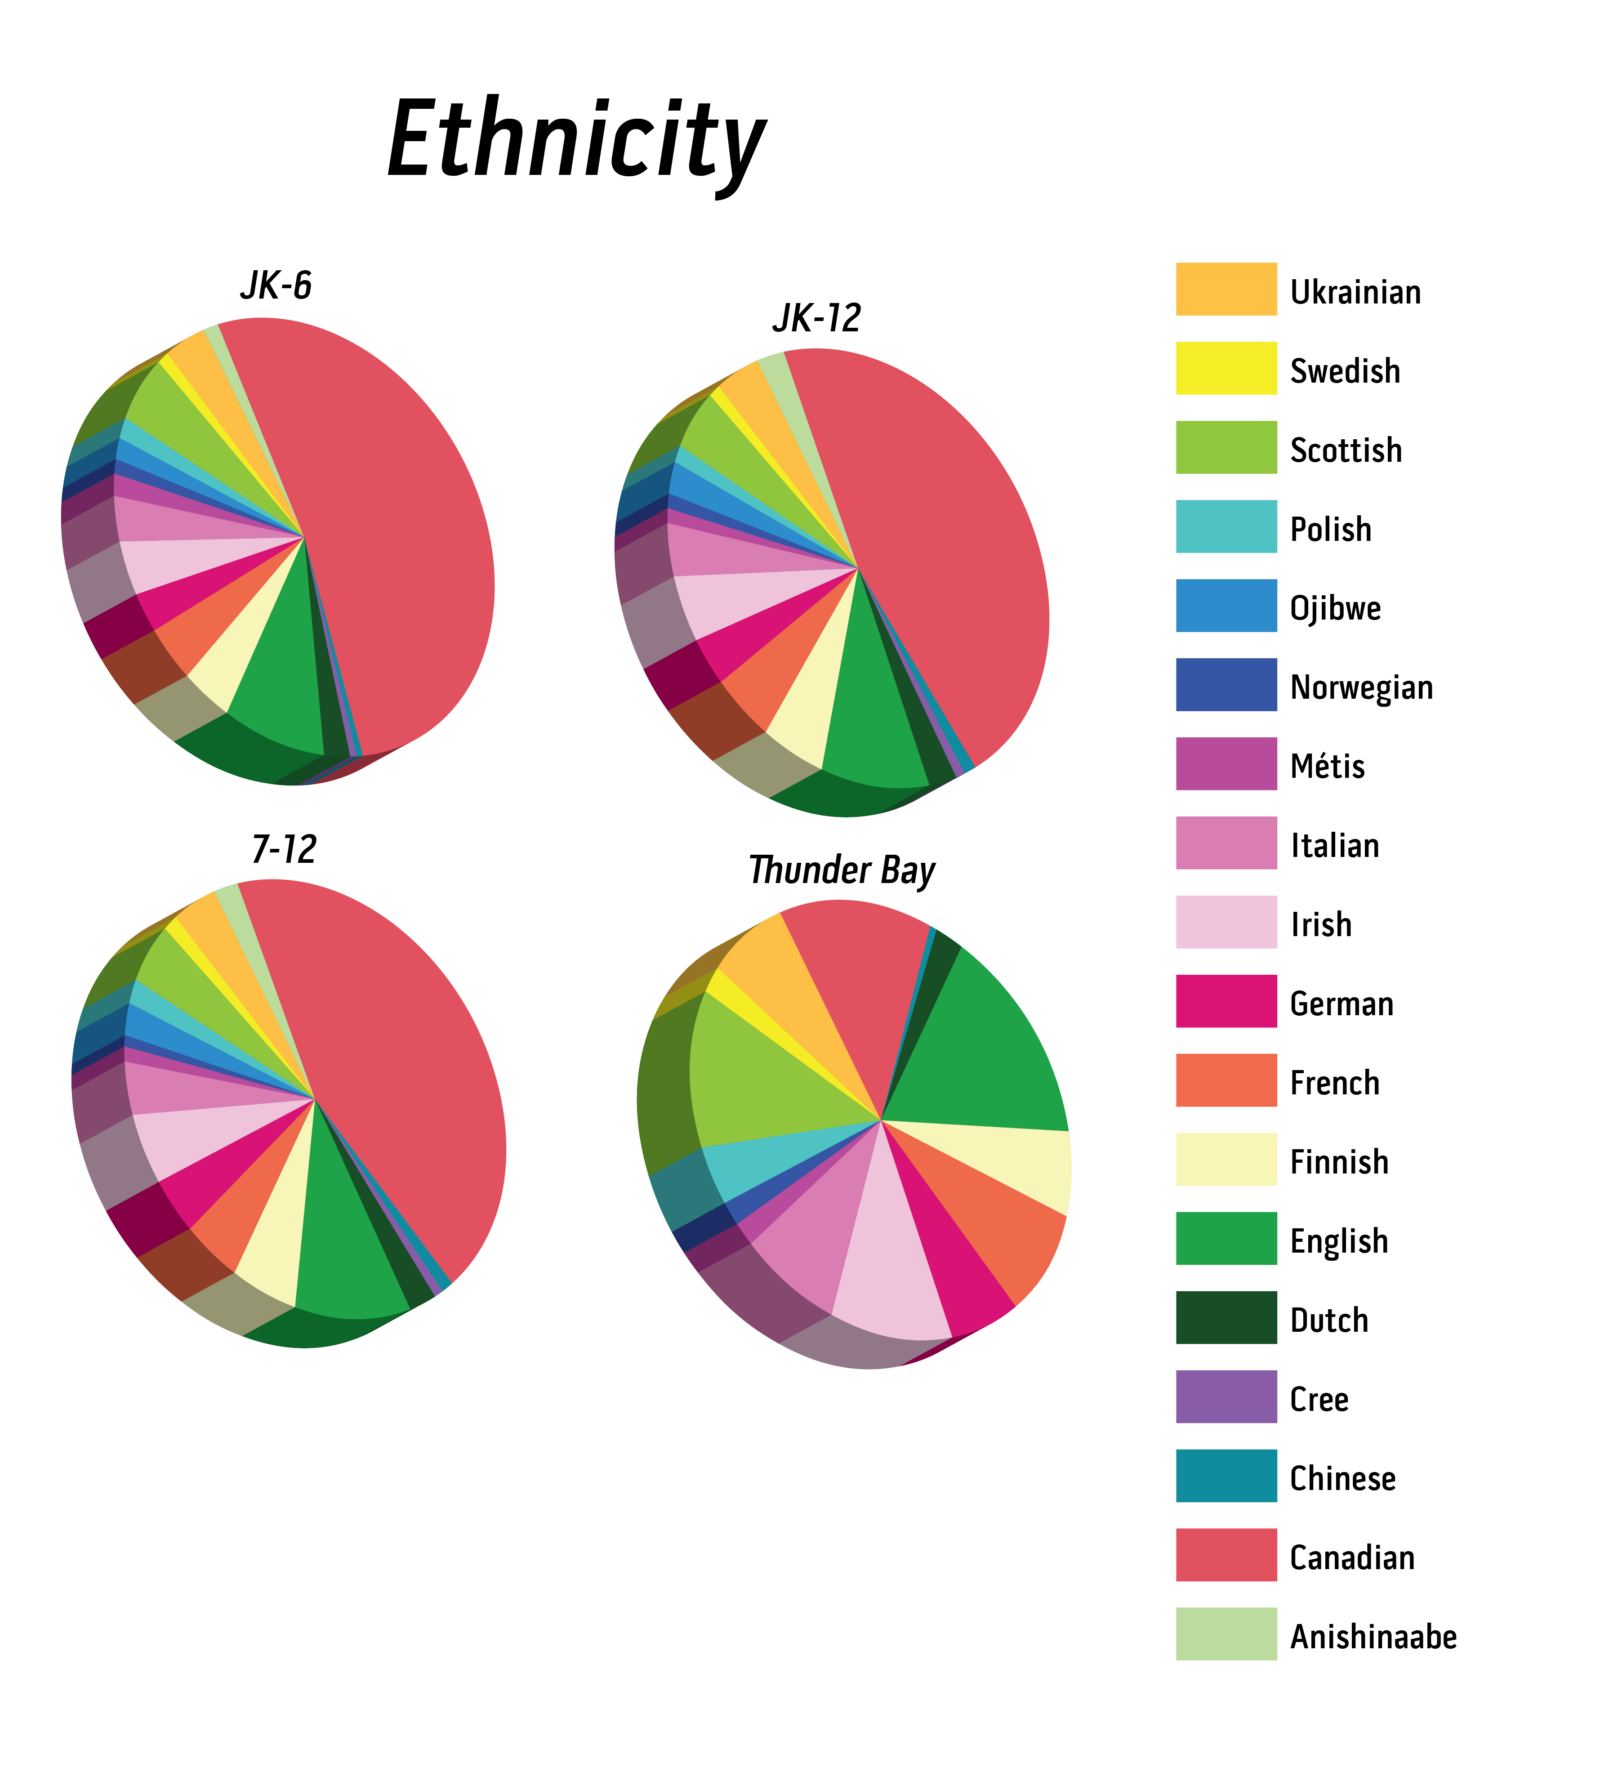
| Demographic Category | JK-6 | 7-12 | JK-12 | Thunder Bay |
| Ethnicity | ||||
| Anishinaabe | 3% | 5% | 5% | |
| Canadian | 95% | 89% | 91% | 23% |
| Chinese | <1% | 2% | 2% | <1% |
| Cree | <1% | 2% | 2% | |
| Dutch | 4% | 5% | 5% | 4% |
| English | 15% | 20% | 18% | 27% |
| Finnish | 7% | 11% | 10% | 11% |
| French | 7% | 9% | 9% | 16% |
| German | 5% | 8% | 7% | 11% |
| Irish | 7% | 10% | 9% | 18% |
| Italian | 6% | 8% | 8% | 14% |
| Métis | 3% | 2% | 2% | 3% |
| Norwegian | 2% | 2% | 2% | 3% |
| Ojibwe | 3% | 5% | 5% | |
| Polish | 3% | 4% | 3% | 7% |
| Scottish | 10% | 10% | 10% | 21% |
| Swedish | 2% | 3% | 2% | 4% |
| Ukrainian | 7% | 8% | 8% | 13% |
| Ethnicities <1% each |
· Ethnicities <1% each indicates that other ethnicities were identified but less than 1% of the census respondents indicated it was their ethnicity. These ethnicities included: Arab, British, Colombian, Danish, El Salvadorean, Filipino, Hindu Indian, Hungarian, Japanese, Jewish, Mennonite, Mongolian, Nepalese, Nigerian, Portuguese, Russian, Spanish, Syrian, Vietnamese, and Welsh.
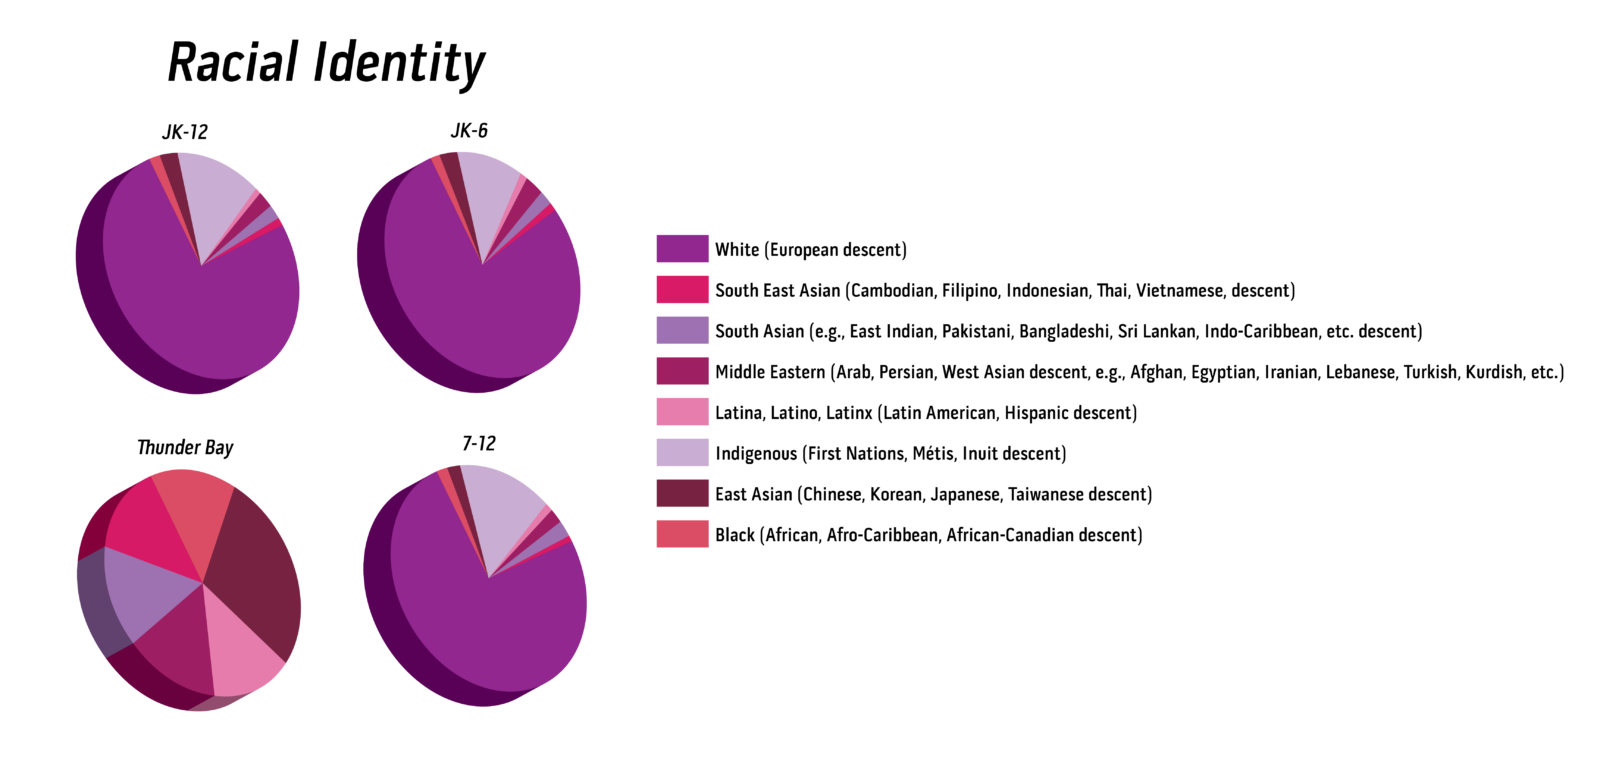
| Demographic Category | JK-6 | 7-12 | JK-12 | Thunder Bay |
| Racial Identity | ||||
| Black (African, Afro-Caribbean, African-Canadian descent) | 2% | 2% | 2% | <1% |
| East Asian (Chinese, Korean, Japanese, Taiwanese descent) | 3% | 2% | 3% | 2% |
| Indigenous (First Nations, Métis, Inuit descent) | 11% | 14% | 13% | |
| Latina, Latino, Latinx (Latin American, Hispanic descent) | <1% | 1% | 1% | <1% |
| Middle Eastern (Arab, Persian, West Asian descent, e.g., Afghan, Egyptian, Iranian, Lebanese, Turkish, Kurdish, etc.) | 3% | 2% | 2% | <1% |
| South Asian (e.g., East Indian, Pakistani, Bangladeshi, Sri Lankan, Indo-Caribbean, etc. descent) | 2% | 2% | 2% | <1% |
| South East Asian (Cambodian, Filipino, Indonesian, Thai, Vietnamese, descent) | <1% | 1% | 1% | <1% |
| South East Asian (Cambodian, Filipino, Indonesian, Thai, Vietnamese, descent) | 80% | 71% | 74% | |
| Racial Identities <1% each |
· Racial identities <1% each indicates that other races were identified by less than 1% of the census respondents. These racial identities included; I don’t know, Jewish, Magrahbi, Polynesian, and Samoan.
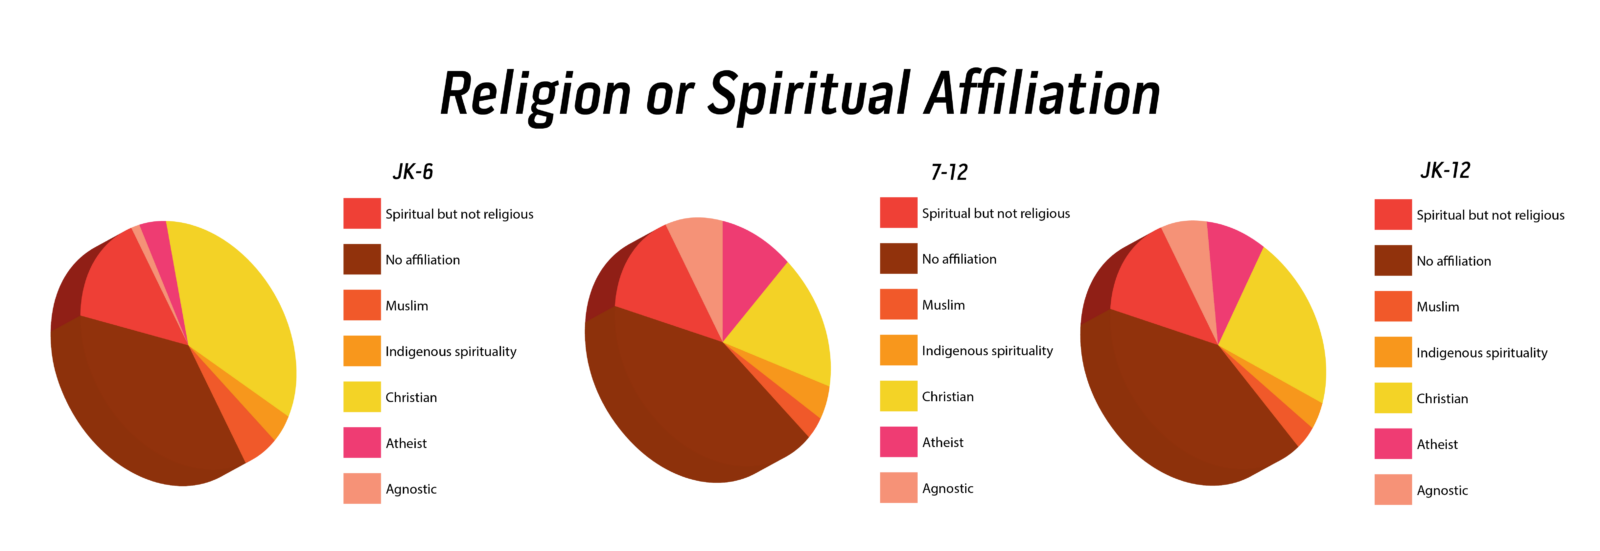
| Demographic Category | JK-6 | 7-12 | JK-12 |
| Religion or Spiritual Affiliation | |||
| Agnostic | <1% | 8% | 6% |
| Atheist | 3% | 9% | 7% |
| Christian | 24% | 15% | 18% |
| Indigenous spirituality | 3% | 4% | 3% |
| Muslim | 4% | 3% | 3% |
| No affiliation | 24% | 36% | 32% |
| Spiritual but not religious | 11% | 13% | 12% |
| Spiritual affiliations <1% each |
· Spiritual affiliations <1% each indicates that other spiritual affiliations were identified but less than 1% of the census respondents indicated it. These spiritual affiliations included; Buddhist, Hindu, Jewish, Lutheran, Pagan, Pentacostal, Satanist, Sikh, and Wiccan
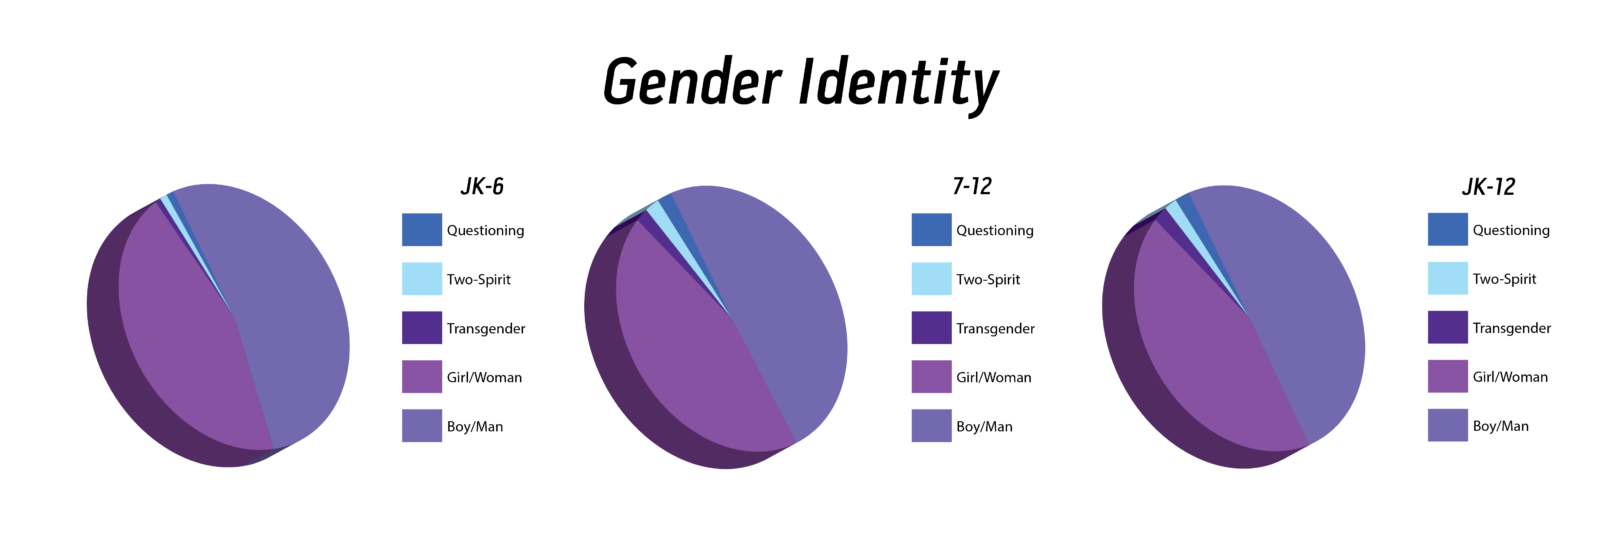
| Demographic Category | JK-6 | 7-12 | JK-12 |
| Gender Identity | |||
| Boy/Man | 54% | 47% | 49% |
| Girl/Woman | 44% | 42% | 42% |
| Transgender | <1% | 2% | 2% |
| Two-Spirit | <1% | 2% | 2% |
| Questioning | <1% | 2% | 2% |
| Gender identities <1% each |
· Gender identities <1% each indicates that other genders were identified by less than 1% of the census respondents. These identities included: bigender, demi-girl, gender fluid, non-binary.
| Demographic Category | JK-6 | 7-12 | JK-12 |
| Disability | |||
| No | 84% | 66% | 72% |
| Not sure | 3% | 13% | 10% |
| Yes | 11% | 16% | 14% |
| If Yes, Addiction disability | <1% | 2% | 2% |
| If Yes, Blind or low vision disability | <1% | 3% | 2% |
| If Yes, Learning disability | 2% | 5% | 4% |
| If Yes, Mental health disability | 2% | 14% | 10% |
| If yes, Pain disability | <1% | 3% | 2% |
| Disabilities <1% each |
· Disabilities <1% each indicates that other disabilities were identified by less than 1% of the census respondents. These disabilities included; ADHD, physical disability, epilepsy, deaf or hard of hearing, dermatographia, autism, memory.
| Demographic Category | 7-12 | JK-12 |
| Sexual orientation | ||
| Asexual | 1% | 1% |
| Bisexual | 7% | 7% |
| Gay | 1% | 1% |
| Heterosexual | 68% | 68% |
| I prefer not to answer | 5% | 5% |
| Lesbian | 2% | 2% |
| Not sure | 3% | 3% |
| Pansexual | 3% | 3% |
| Disabilities <1% each |
· Sexual orientation <1% each indicates that other sexual orientations were identified by less than 1% of the census respondents. These sexual orientations included; A-spec, Aroace, Bi-curious, not labelled, omnisexual, pomosexual, and Sapphic.
Summary of Parent 1 Data for the LDSB
| Demographic Category | JK-6 | 7-12 | JK-12 |
| Highest level of education | |||
| Apprenticeship | <1% | 1% | 1% |
| College | 28% | 23% | 26% |
| Elementary school | 2% | 5% | 5% |
| High school | 13% | 13% | 12% |
| University | 55% | 42% | 45% |
| No response | 2% | 5% | 4% |
| Not sure | <1% | 11% | 8% |
| Relationship with child | |||
| Father | 13% | 17% | 17% |
| Foster parent | 2% | 1% | 1% |
| Grandparent | 2% | 2% | 2% |
| Guardian< | <1% | 1% | 1% |
| Mother | 81% | 72% | 74% |
| Mother | <1% | 2% | 2% |
| Relationship with child <1% | |||
| Employment status | |||
| Looking for work | 2% | 4% | 3% |
| Retired | 2% | 2% | 2% |
| Self-employed | 8% | 9% | 8% |
| Stay at home | 17% | 10% | 11% |
| Work full-time | 64% | 59% | 60% |
| Work part-time | <1% | 11% | 12% |
| Employment status<1% |
Summary of Parent 2 Data for the LDSB
| Demographic Category | JK-6 | 7-12 | JK-12 |
| Highest level of education | |||
| Apprenticeship | 6% | 3% | 4% |
| College | 28% | 22% | 25% |
| Elementary school | 4% | 4% | 4% |
| High school | 15% | 14% | 14% |
| University | 37% | 30% | 31% |
| No response | 9% | 15% | 14% |
| Not sure | 1% | 15% | 9% |
| Relationship with child | |||
| Father | 70% | 54% | 56% |
| Foster parent | 2% | 1% | 1% |
| Grandparent | 2% | 3% | 3% |
| Guardian< | 1% | 1% | 1% |
| Mother | 14% | 17% | 17% |
| Mother | 4% | 3% | 4% |
| Relationship with child <1% | |||
| Employment status | |||
| Looking for work | 2% | 3% | 3% |
| Retired | 2% | 4% | 3% |
| Self-employed | 7% | 8% | 8% |
| Stay at home | 3% | 5% | 5% |
| Work full-time | 74% | 60% | 61% |
| Work part-time | 5% | 6% | 6% |
| Employment status<1% |